Spectacular temperature breaks off North Cape, New Zealand are a common occurrence in summer. In this blog I describe these fronts and highlight features relevant to gamefishing. I discuss the currents, the “altimetry”, warm and cool water features, and the temperature breaks.
Bottom depth or Bathymetry
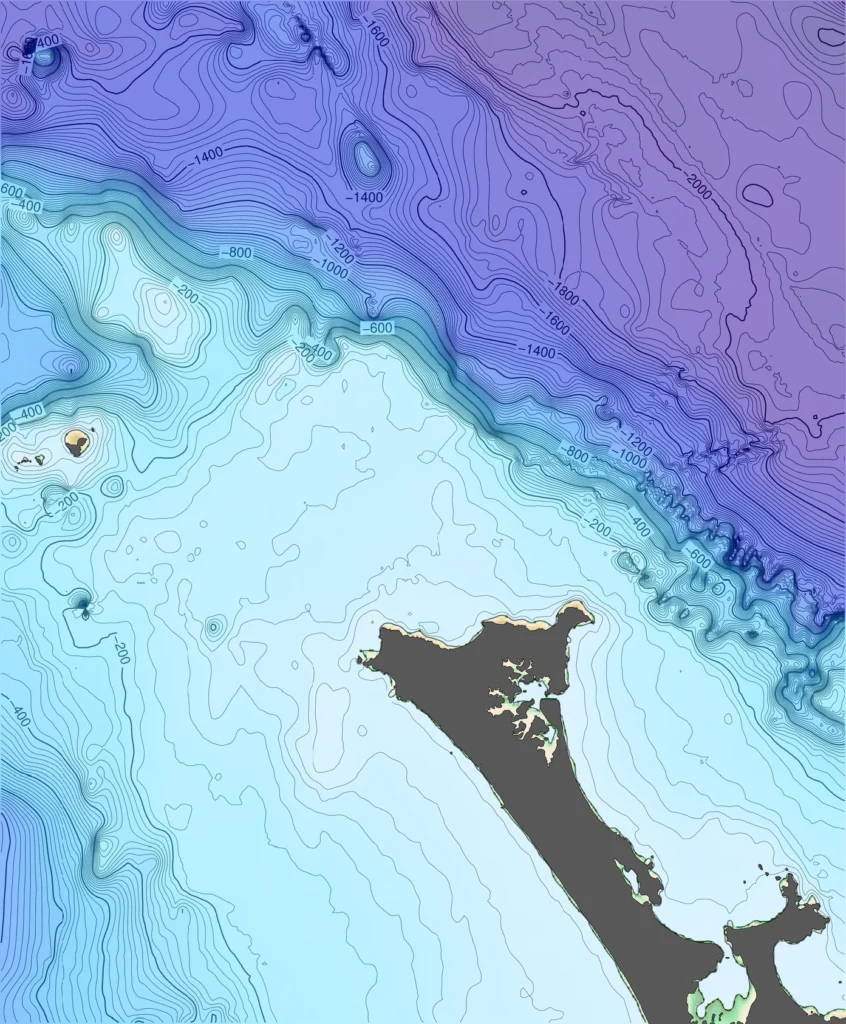
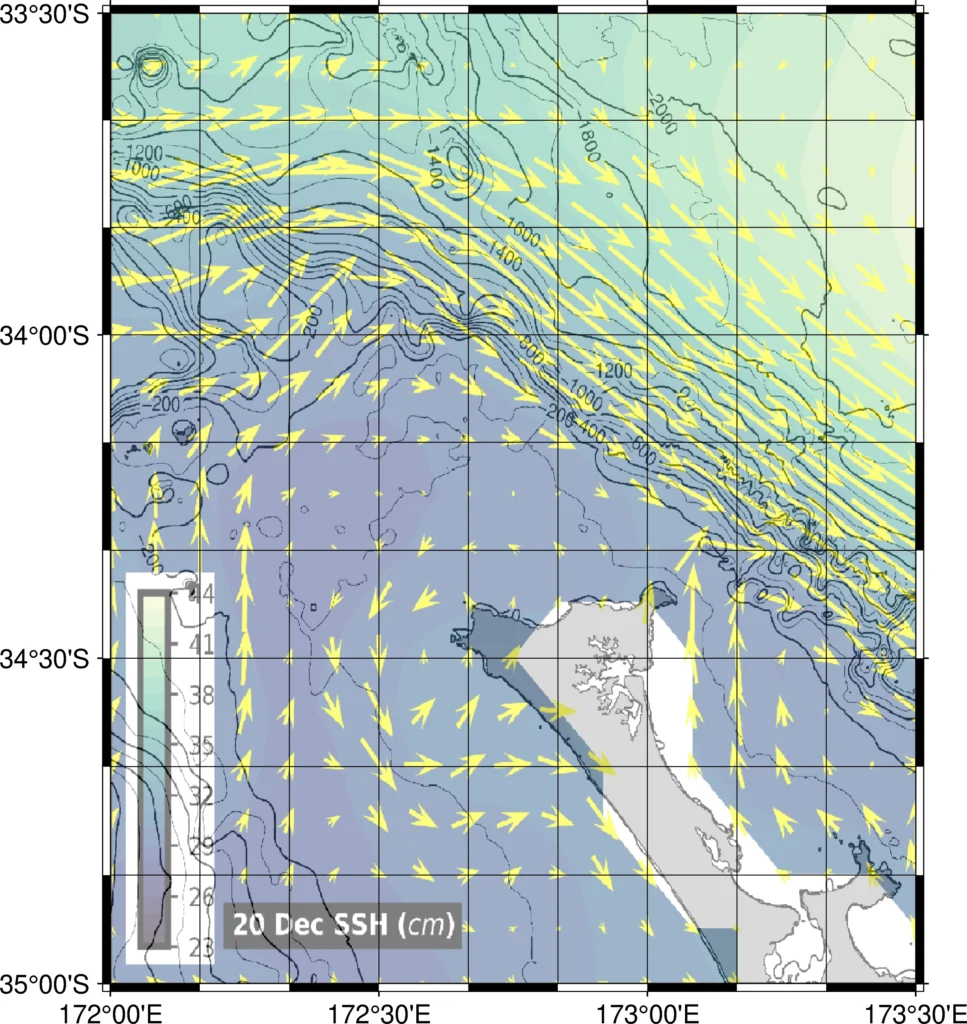
The shelf break to the east of North Cape has a very steep drop off to deeper waters, going from 200 metres at the shelf edge to 1800 m in a relatively short distance (Figure 1). This steep shelf break causes “topographic steering” of the East Auckland Current. What this means is that the current follows the depth contours. The East Australian Current arrives from the east and passes around North Cape where it becomes the southward flowing East Auckland Current. As the current flows along the shelf edge it forms a “jet” which is a river-like flow of stronger current, indicated by the longer arrows in Figure 2.
Sea Surface Height (SSH) boundaries and fishing
Gamefishing can be better at the boundary between high and low sea surface height. Why is that? In a nutshell, it is because the SSH boundary is an area where currents develop.
How does that work?
The strengthening of the East Auckland Current is driven by the difference in Sea Surface Height between the offshore waters and the water over the shelf (shallower than 200 metres). In the offshore, sea surface height (SSH) is about 40 centimetres above the reference point (yellow colour in Figure 2). In contrast, SSH is about 28 cm over the shelf (purple colour in Figure 2). This means that there is a difference of 12 cm in sea surface height between offshore and inshore. This creates a pressure gradient between the “High” and the “Low”, just like the highs and lows on TV weather maps. Flow tends to go from high to low, and in the southern hemisphere, the earths rotation deflects the flow to the left, so you get a southward flowing current, as you can see in Figure 2. The strength of the current is dependent on the strength of the pressure gradient, which is driven by the difference in sea surface height. The East Auckland Current is strong at this time because the SSH gradient is strong.
Fishing on SST and SSH boundaries
Gamefishing can be good where a SSH boundary and warm water boundary align with a bottom feature like steep bathymetry at the shelf edge. SST and SSH boundaries are aligned off the east coast of North Cape, although the warmest water is well off the shelf break, and over deep water.
What’s the detail on that?
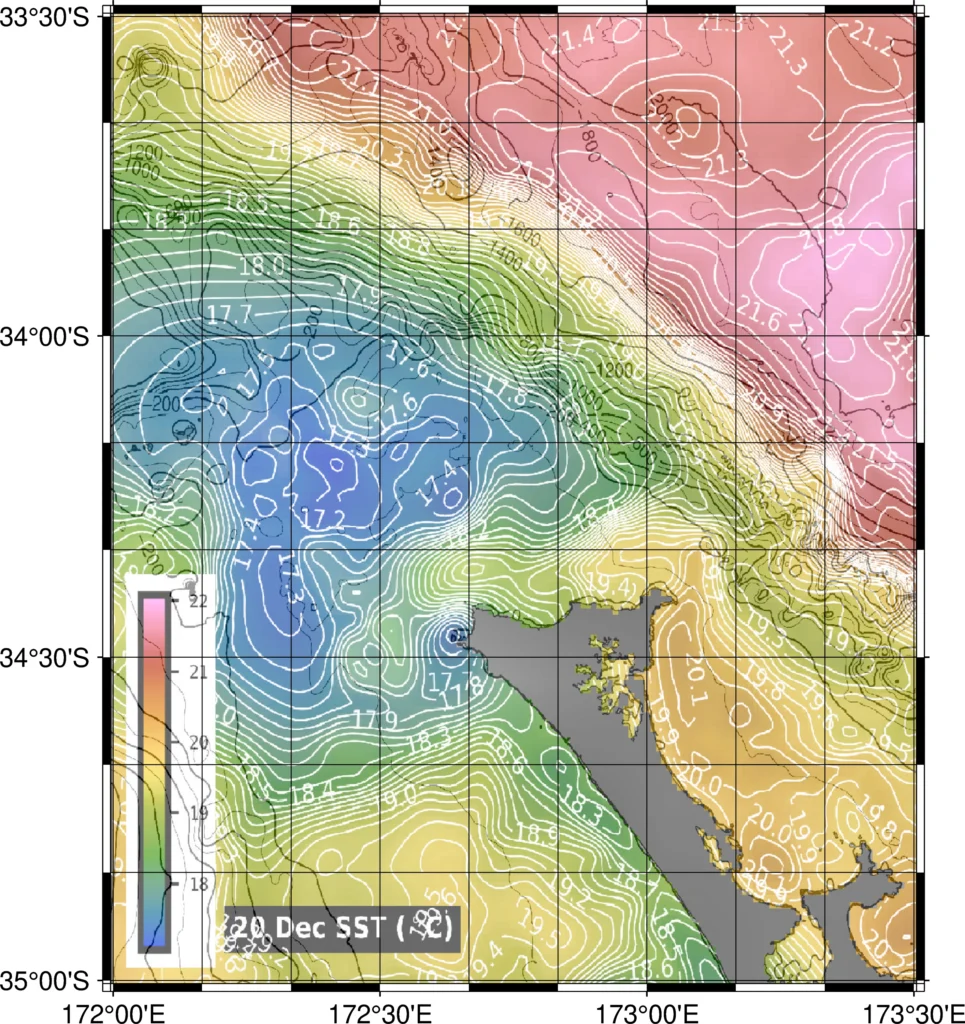
The strong SST boundary creating a strong temperature break aligns with the strong SSH boundary strengthening the East Auckland Current. SST as warm as 21.5C lies to the east of the East Auckland Current, which is the southward-flowing current jet indicated by the long arrows in Figure 2. There is a very strong temperature gradient (indicated by the closely spaced white lines on the SST map) between this 21.5C water and 18.5C SST along the 1,200 metre line (Figure 3). The core of the East Auckland Current also lies over the 1,200 metre depth contour (Figure 2). The warmest water is east of the 1,800 metre depth contour (Figure 3). This is over the continental slope, rather than the shelf breaks which is at 200 metres.
Gamefishing can be good on the edges of eddies
Further west, there is a cold pool of 17 to 17.5C water that is formed by the semi-permanent North Cape Eddy (Figure 3). The North Cape eddy has temperature breaks on its southern edges, and higher production.
How does that work?
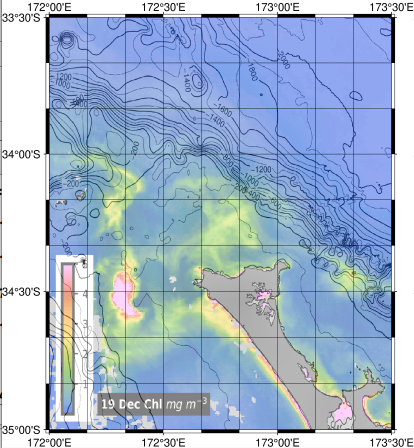
The North Cape eddy is a semi-permanent rotating body of water, slowly spinning in a clockwise (or cyclonic) direction. SSH in the eddy centre is low, so pressure compensation over the water column means that the mixed layer depth, which is often coincident with the thermocline, can bow upward in the eddy. The rule of thumb is that when an eddy has low sea surface height, the mixed layer is shallower. It’s all due to water density and pressure gradients. Because the mixed layer is shallower in the cold-core, clockwise-rotating eddy, this brings nutrient rich deeper water closer to the surface and into depths where there is more light, so phytoplankton grow better, and chlorophyll increases in the eddy (Figure 4). Note that this is a different process from upwelling.
Cutting through the detail
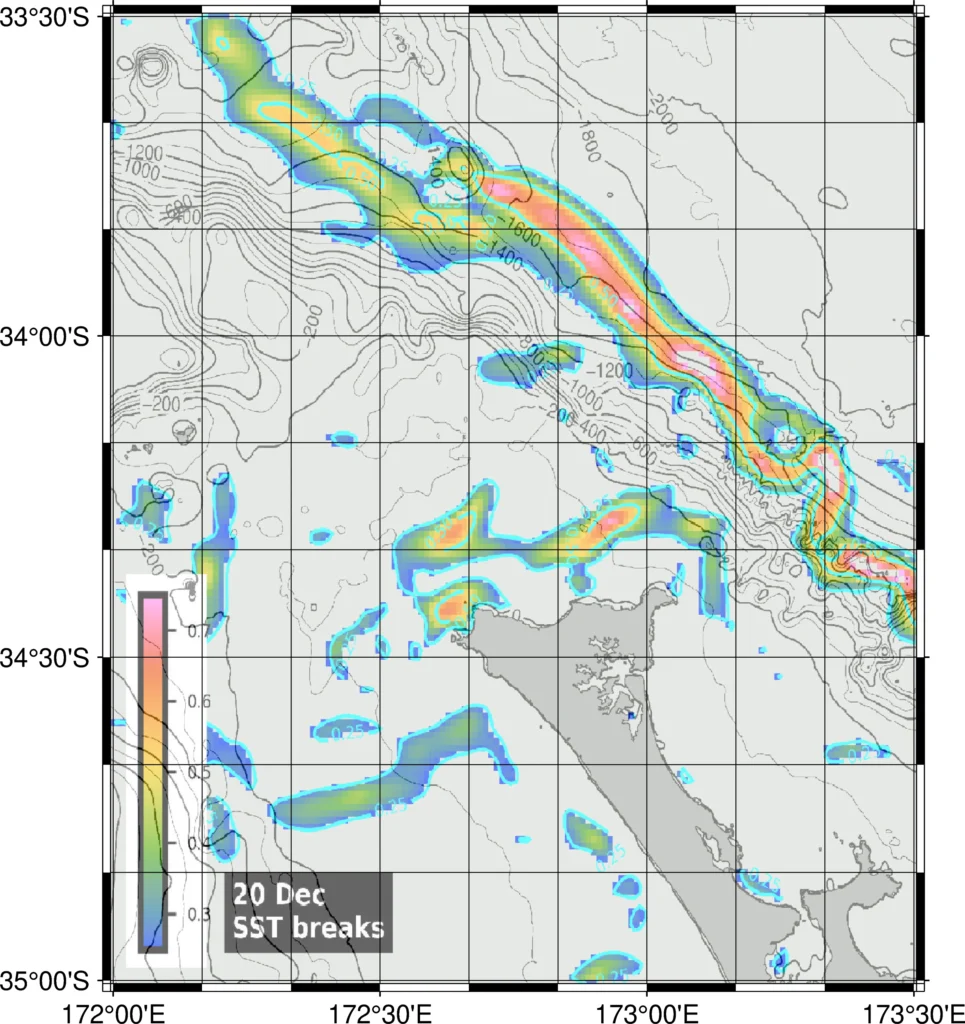
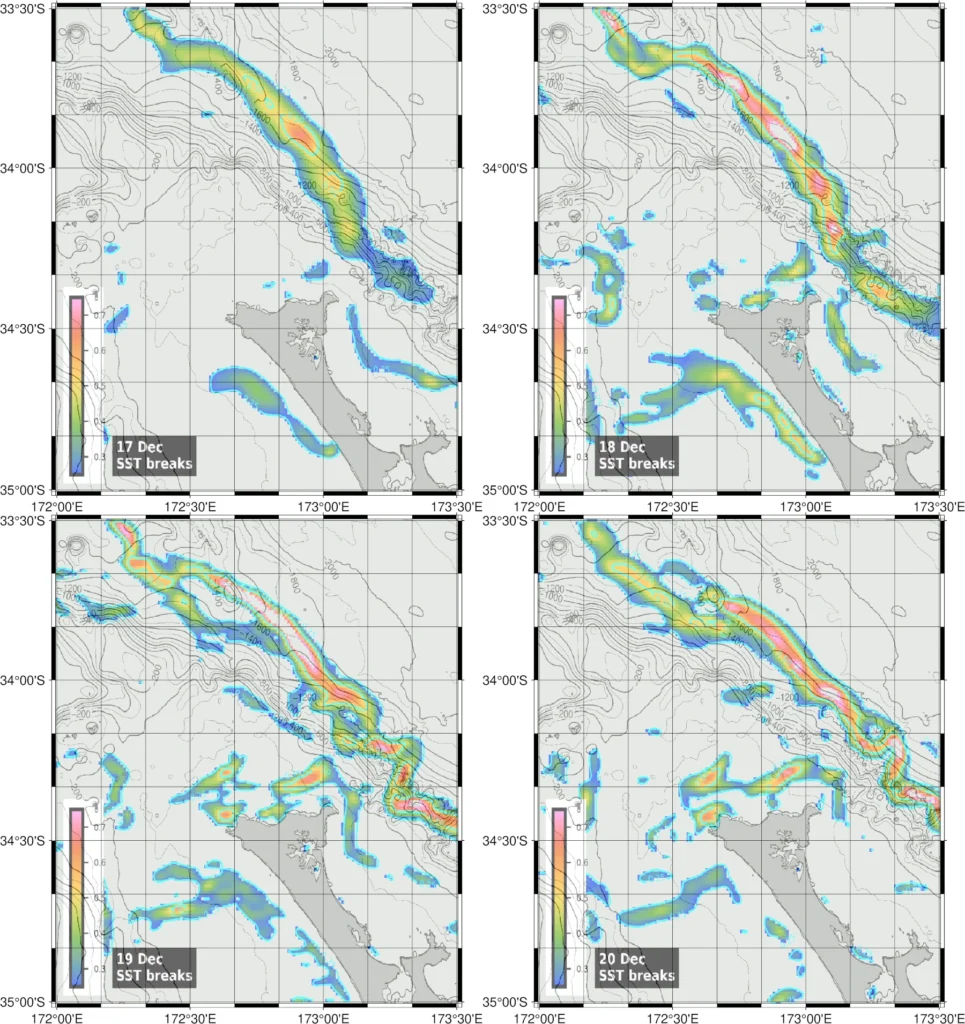
Now that the oceanography has been explained, the bottom line is that SST fronts or temperature breaks maps indicate good areas to fish. Temperature breaks (Figure 5) are often aligned with chlorophyll fronts where cooler, green water with higher chlorophyll transitions to clearer, warmer blue water (Figure 4). The strength of the temperature gradient varies along the breaks, with red colour indicating the strongest breaks. Figure 5 shows strong temperature breaks off the shelf edge, and also on the southern edges of the North Cape eddy, closer to shore. Another important thing to look for is whether the location of the temperature breaks has been persistent. Use the 4-day maps for this (Figure 6). In this example, the breaks have been remarkably consistent over the most recent four days, and this will have allowed concentrations of plankton to develop and attract baitfish.
