Altimetry is commonly offered as a product in various kinds of fishing maps. It is sometimes used to mean the same thing as Sea Surface Height, but the two are actually different. You can think of Sea Surface Height as “altimetry plus some other stuff”. Sea Surface Height data are often provided as a modelled product. These data are obtained by using mathematical simulation of ocean conditions (called models) that are tuned using measurements. These measurements are collected by radar sensors on satellites (altimetry), as well as from profiling instruments dropped from ships, transported on floats that drift with the currents and move vertically, or from instrument arrays hanging beneath fixed buoys.
The use of Sea Surface Height for sport fishing is generally given as rule of thumb. You might have read that a good place to fish is in the middle of an area of low Sea Surface Height, such as occurs in cold-core eddies (which are rotating bodies of water with a cool centre). Another rule is to fish between areas of high and low Sea Surface Height. These areas can occur when you have adjacent bodies of water that are each rotating in opposite directions. These are called counter-rotating eddies. The third rule that is commonly offered is that eddies with high Sea Surface Height in their centres are biological deserts and are not good areas to fish. While these rules of thumb are useful in a general sense, it helps to get a deeper sense of why Sea Surface Height is important, and this involves understanding a little about how Sea Surface Height, currents, and the mixed layer work. Once you understand that, you can go beyond “rules of thumb” and interpret the maps more effectively.
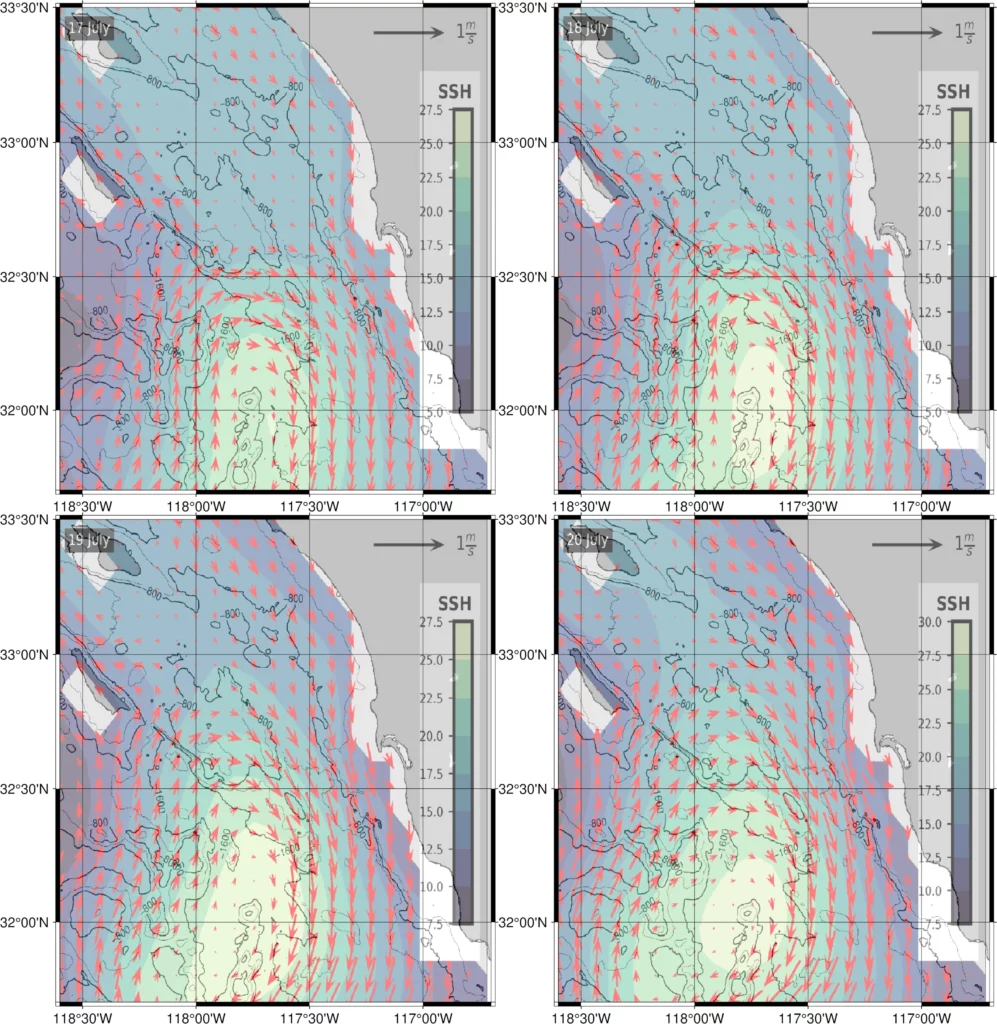
The first thing to note is that, at the moment, available Sea Surface Height data and Mixed Layer depth data are relatively coarse, with a resolution of about 8 kilometers (5 miles). This means that you can only detect features that are quite large. Large eddies with diameters of 25 to 50 kilometers (15 to 30 miles) are detectable. You may have noticed that the example maps showing altimetry data for sport fishing tend to cover quite large areas. That’s because the eddies shown in the maps are large. It may not be easy to see patterns at smaller scales. The second thing is that patterns take time to develop. For this reason it is useful to look at the 4 day map panels to see how patterns of sea surface height are developing. Even where eddies can be clearly seen, it takes at least 3 to 4 days to be able to see any effect on chlorophyll because the doubling time for phytoplankton is about 2 days. So the clearest patterns will be seen when eddies occur in all 4 days.
The problem is that the ocean has eddies at all scales. This is nicely illustrated by this visualization of a model of ocean circulation showing the pattern of eddies in different parts of the ocean (See this amazing video Video by NOAA GFDL https://www.gfdl.noaa.gov ) . Large eddies spawn small eddies that are surrounded by smaller eddies, and so on. It’s what is called a fractal pattern. If you could zoom in to the field of eddies, the more eddies you would see.
So if Sea Surface Height maps for sport fishing only show you the coarse detail, are they any use? The answer is yes, but lets now look at why they are useful. Fish don’t respond to Sea Surface Height, but they do respond to two things that are affected by Sea Surface Height. These are Mixed Layer Depth and productivity.
How Sea Surface Height affects Productivity through Mixed Layer Depth
It might seem strange, but a good analogy is the weather maps. Most people are familiar with the movement of high and low pressure areas on weather maps. The intensity of these features varies and extreme highs or lows are surrounded by closely spaced isobars (lines of even pressure) which are just contour lines of the pressure distribution. Cold and warm fronts are areas where the contours are close together due to rapid changes in air pressure. Both the centres of high and low pressure and the fronts move across the weather maps as the weather systems move. The wind direction follows the contour lines, and wind strength varies with how close the contour lines are. When the pressure contours are closely spaced, the winds are stronger because the pressure gradient is steeper. The wind would blow from high pressure to low pressure due to the pressure gradient if the earth was not rotating. Since the earth rotates, there is a centrifugal force (called the coriolis force) on the wind that pulls the wind to the right in the northern hemisphere and to the left in the southern hemisphere. The direction of wind flow is due to a combination of the pressure gradient and the coriolis force.
The situation is the same in the ocean, except the densities in water are greater than in air, so the ocean moves more slowly than the atmosphere. Differences in pressure in the ocean are caused by atmospheric forcing. In non-technical terms, the friction from wind and heating from the sun create differences in pressure in the ocean. Areas of high and low pressure are formed in the ocean that resemble the patterns of high and lows in the weather maps.
You can think of areas of high pressure as a tall stack of water, and areas of low pressure as a short stack of water. The tall stacks of water have higher Sea Surface Height (on the order of 10 to 30 centimeters). Imagine that a tall stack of water is heavier than a short stack. Water cannot be compressed, so the weight of the tall stack presses down on the water beneath it, which depresses the Mixed Layer. Recall that the bottom of the mixed layer is where the temperature changes rapidly from warmer surface water to colder deep water (called the seasonal thermocline). So higher Sea Surface Height results in a deeper mixed layer. Nutrients in the cold deep water are pushed below the depth that light reaches, so the phytoplankton don’t grow well, and the water in these high pressure centres is less productive. You may have read that these areas are “biological deserts” but that isn’t the case. It’s just that the phytoplankton species are different, often with smaller cells, and this leads to a food web with a different structure that is less favourable to support the feed of sport fish.
Low pressure centres can be imagined as a short stack of water with lower Sea Surface Height that exert less weight on the water beneath. The cold, deep water at the base of the Mixed Layer is not depressed, but instead actually bows upward toward the surface in these areas. The thermocline (where the water temperature changes rapidly with depth) is closer to the surface in these low pressure centres, so there are more nutrients in the well lit surface water, and the phytoplankton grow faster. The Mixed Layer is shallower in low Sea Surface Height centres, and as a result, the food web is more concentrated in these areas, producing plankton that support feed for sport fish. Sometimes these low pressure areas are described as areas of open ocean “upwelling”. This is not the case because upwelling is where there are vertical currents bringing cold, deep water to the surface, and this process is usually wind-driven or associated with changes in bathymetry or coastline shape. What is actually true is that the thermocline is closer to the surface, and the mixed layer is shallower, so nutrients are available in the upper ocean where sunlight penetrates, and so the food web develops based on larger phytoplankton like diatoms. This is a more favourable food web to support feed for sport fishes.
Sea Surface Height and Eddies
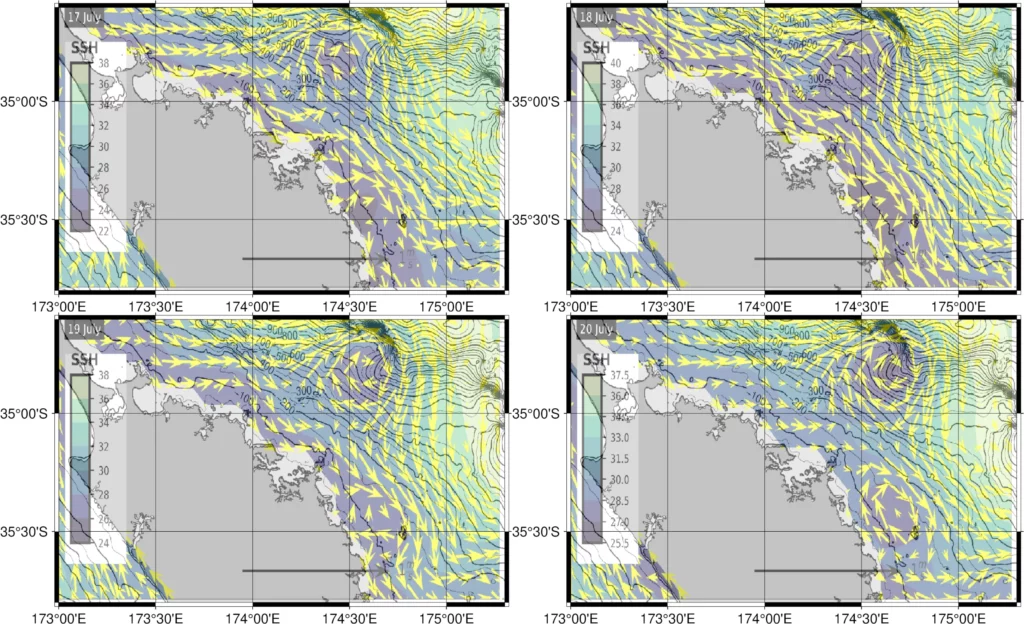
Currents rotate eddies due to the combination of pressure gradients and coriolis force. Currents flow towards a low pressure centre with low Sea Surface Height due to the pressure gradient, and are deflected to the left in the southern hemisphere by the coriolis force. This creates a clockwise rotation which is called a cyclonic eddy in the southern hemisphere. The same low Sea Surface Height centre in the northern hemisphere rotates in the opposite (anticlockwise) direction to create a cyclonic eddy. In both cases, the centre of the low Sea Surface Height eddy is cold because the thermocline is raised, and cold nutrient-rich water is closer to the surface. These are called cold-core eddies.
The same mechanism applied to high pressure centres with high Sea Surface Height, creates anticyclonic eddies. The resulting rotation is in the opposite directions to low pressure centres with low Sea Surface Height. In these high high pressure centres with high Sea Surface Height, the centre is warm because the cold, deep water is depressed, so it has less cooling effect on the surface water. These are referred to as warm-core eddies. Although warm-core eddies are less productive, and less likely to support feed for game fish, their rotation can entrain (or drag in) filaments of cooler, more nutrient rich water. This can lead to the development of areas around the perimeter of a warm-core eddy that is rich in plankton, producing a feeding zone for game fish.
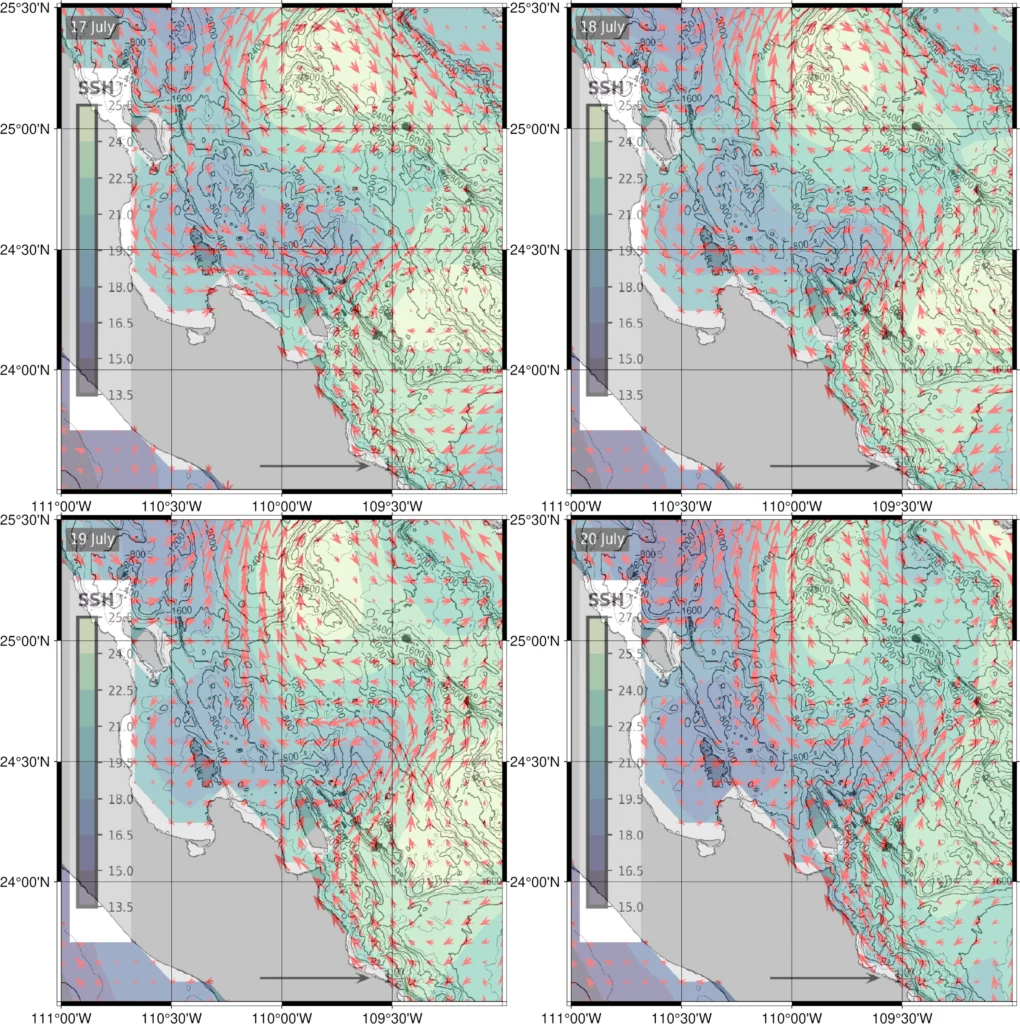
It is quite common in some regions to find a warm-core eddy next to a cold-core eddy. Because these types of eddies rotate in opposite directions, they are referred to as a counter-rotating eddy pair. Counter rotating eddies can be a bonanza for game fishers because there are two good game fishing zones in close proximity. The centre of the cold core eddy is often more productive for plankton, and the perimeter of the warm-core eddy may also support a productive zone.
Finally, it is important to bear in mind that the problems of scale and timing make Sea Surface Height one of the most difficult patterns to interpret at the small scales useful to fishers. Sometimes the expected patterns of Sea Surface Height, Mixed Layer Depth, Chlorophyll and SST just don’t line up. In such cases, the best thing to do is to look at the currents and the other variables rather than Sea Surface Height. Tips on interpreting the large-scale currents in the maps will be the subject of another blog.