The detail in the SST maps is affected by the wind. The reason for this is that wind stress creates friction that mixes the water, and this smooths the temperature gradients. The detail in the maps is reduced after and during windy conditions. You can have a clear calm day after a wind direction change, and the SST structure will still be smoothed out until the water stabilises again, and develops more surface structure. It takes time for the temperature structure to re-establish. How much time depends on how sunny it is, and how calm it is. Both of these factors determine how much heat goes into the surface of the ocean to replace the heat that has been lost by wind mixing. If it is calm and sunny, temperature structure will reform over several days.
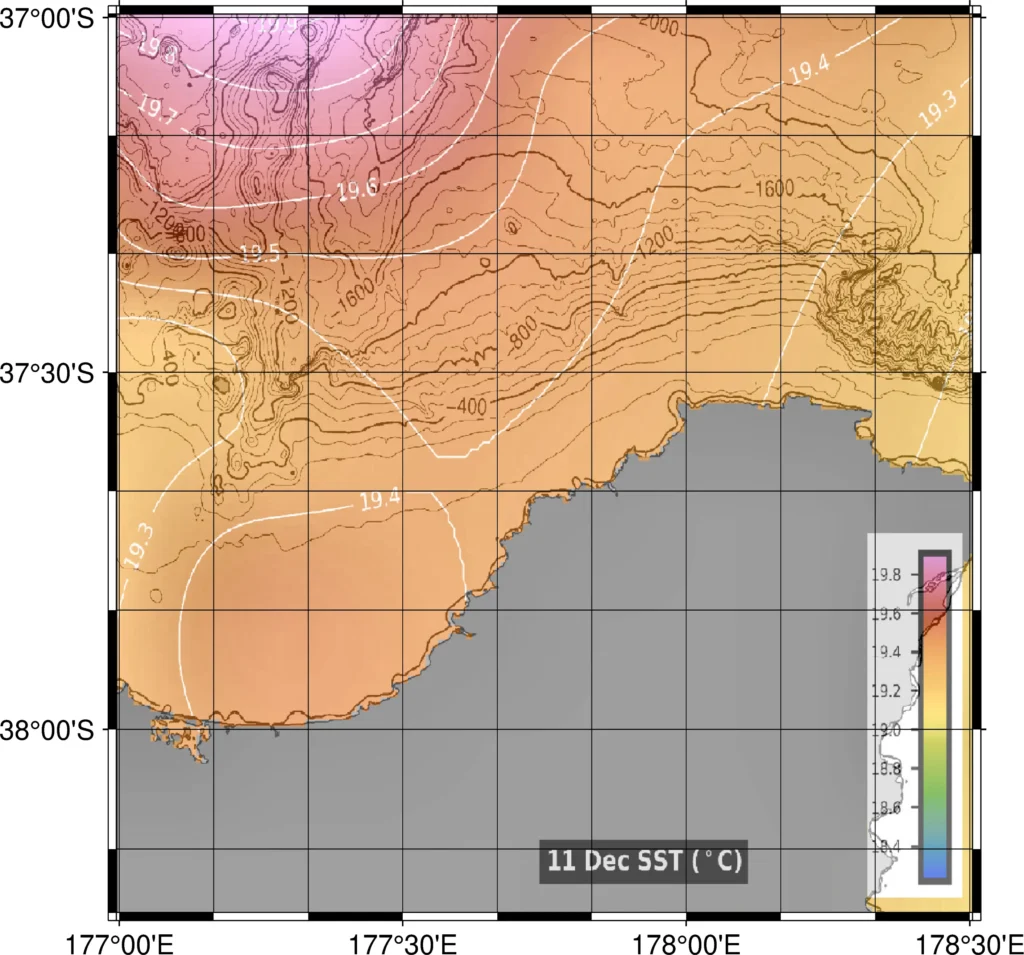
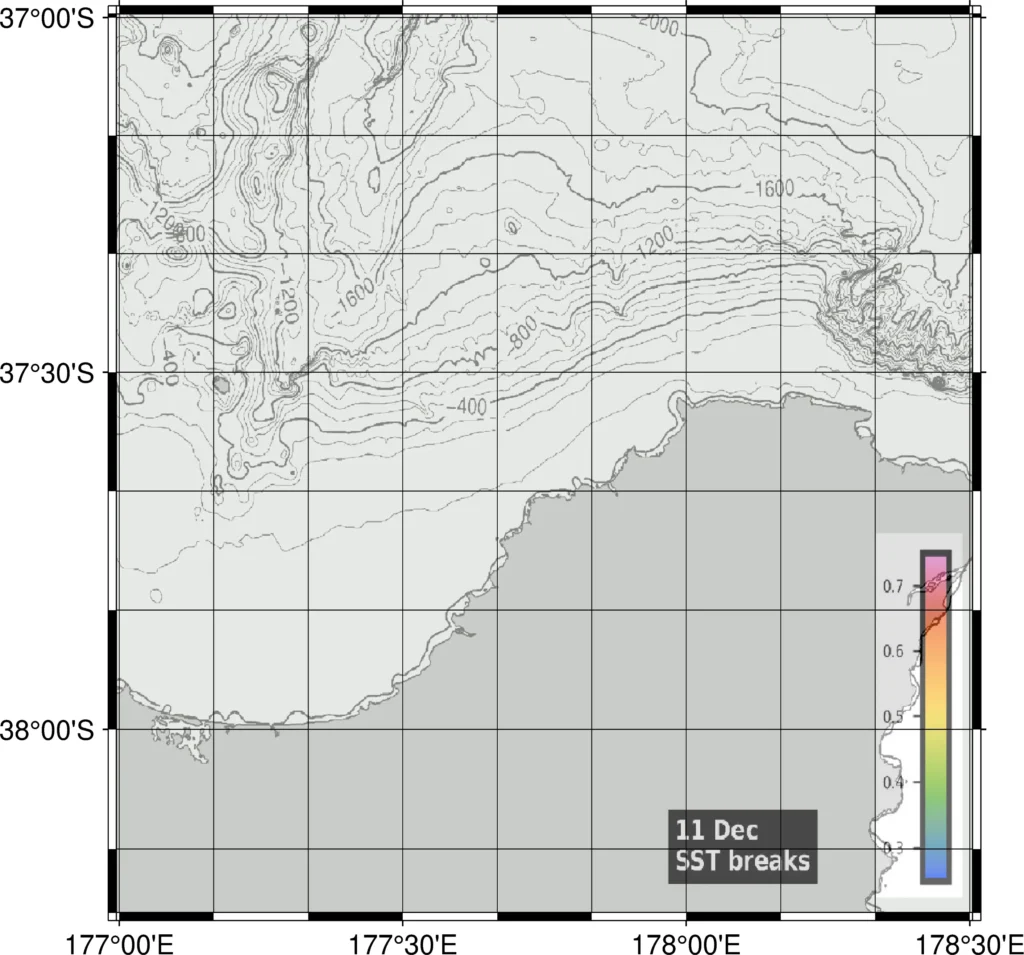
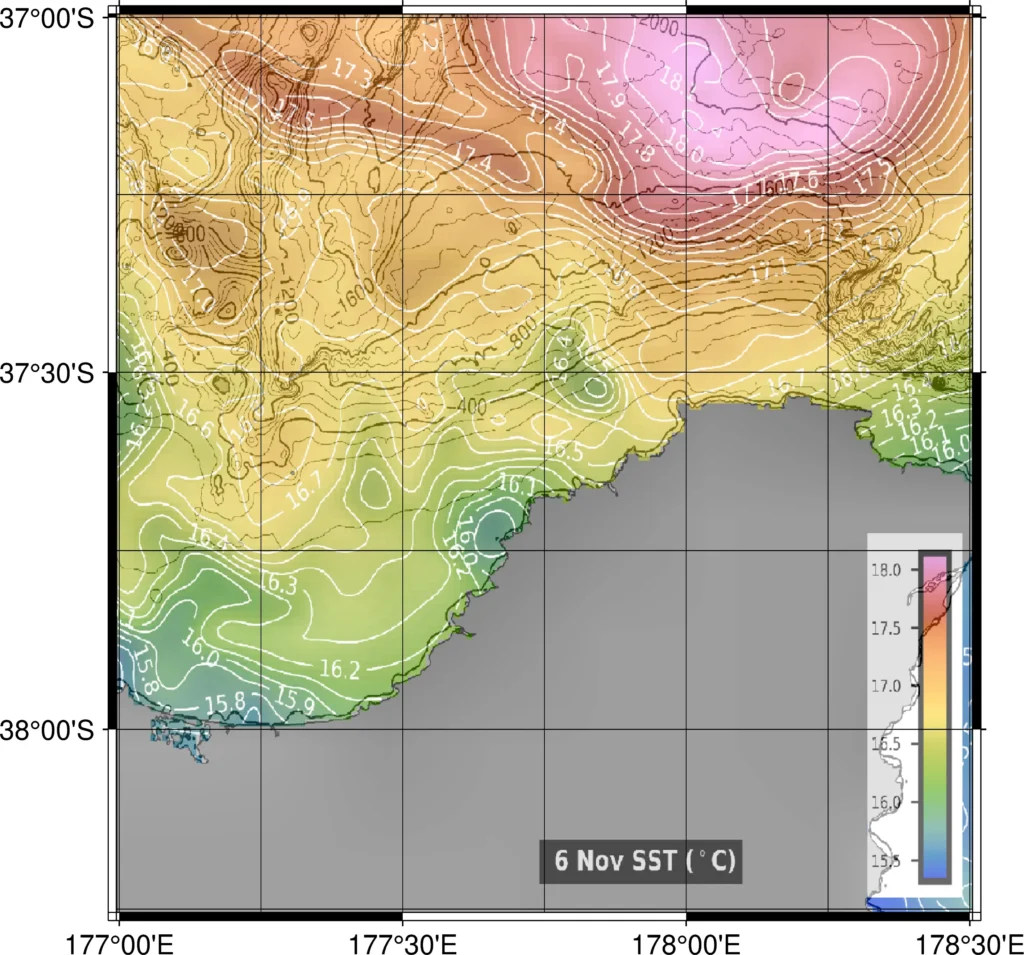
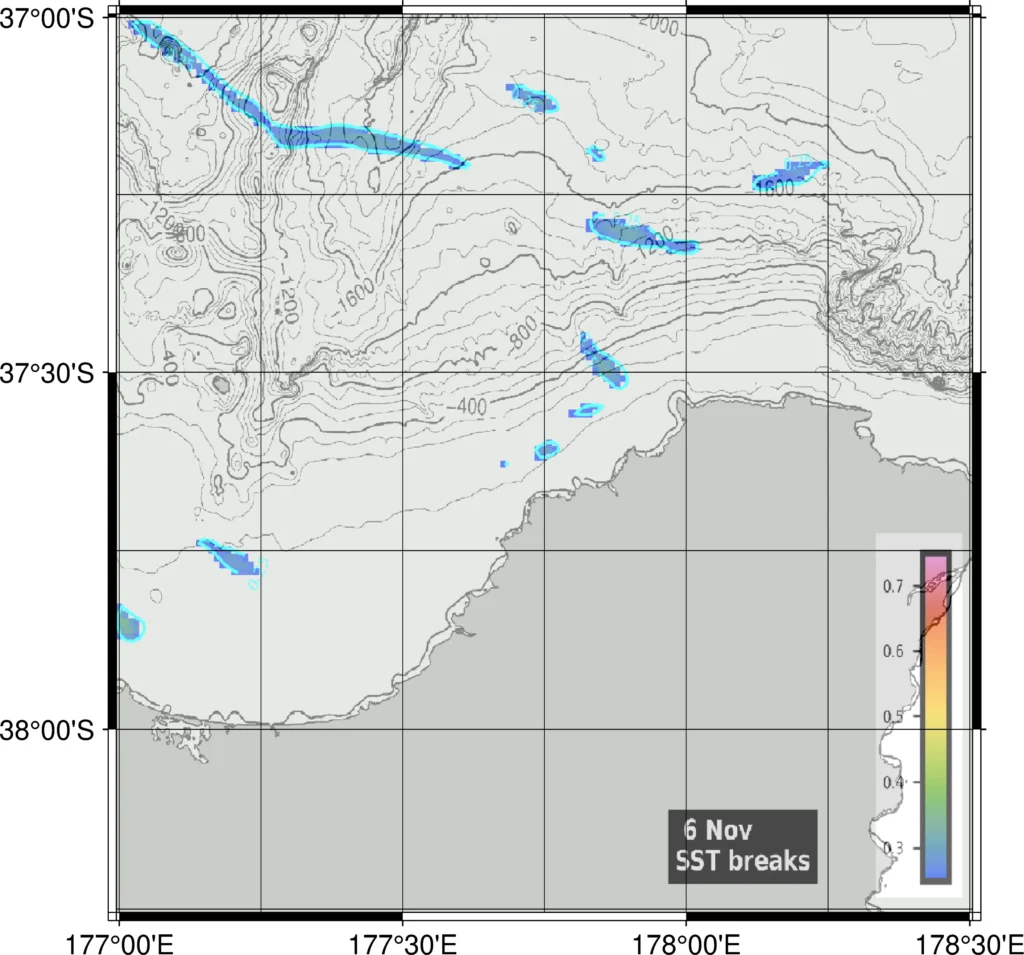
Compare the SST and temperature breaks maps that you can see in Figures 1 & 2. The December 11 SST map in Figure 1 is from Waihau Bay in recent days. The temperature gradients are smoothed out by wind mixing of the surface waters, and there are no strong temperature breaks at all on the corresponding temperature breaks map (Figure 2). Contrast this with Figures 3 and 4 from Waihau Bay in early November. There is a lot more detail in the November 6 SST map (Figure 3) because the conditions were less windy. You can see where there are strong temperature breaks in the November 6 temperature breaks map (Figure 4).
Re-establishing the temperature structure
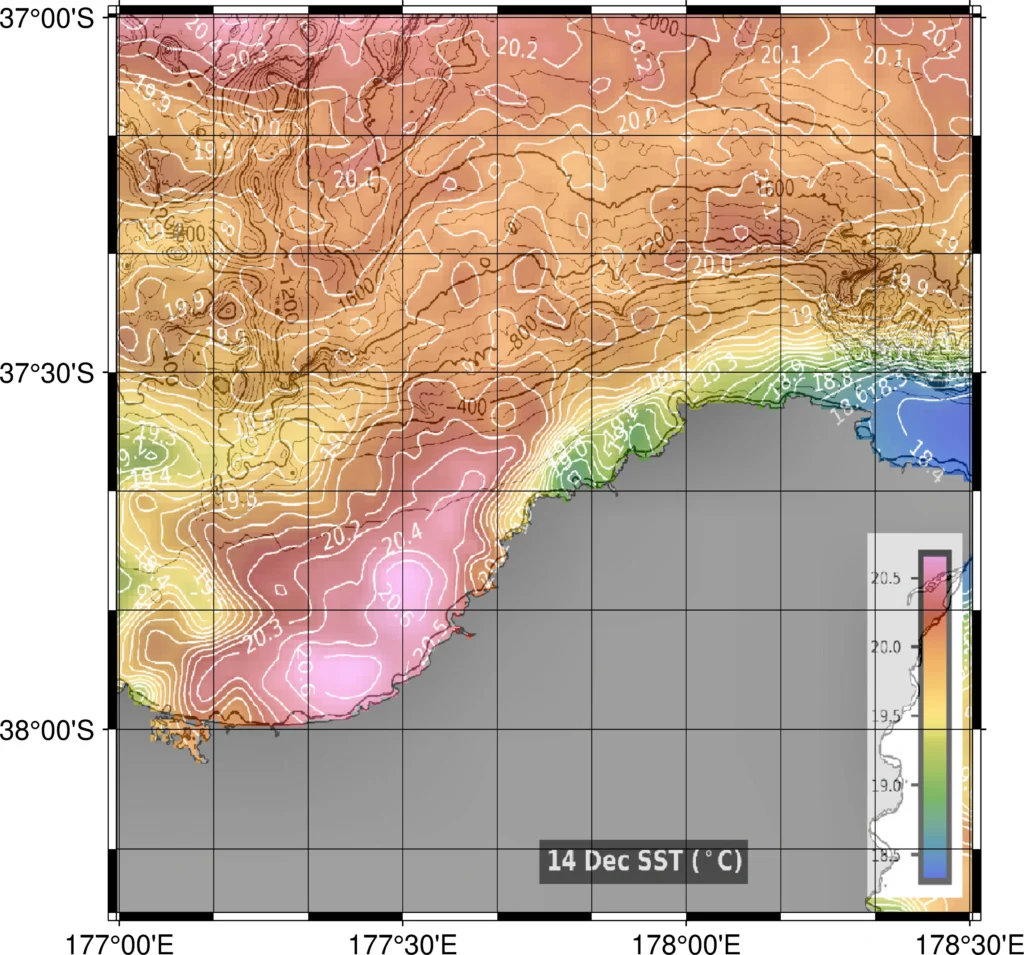
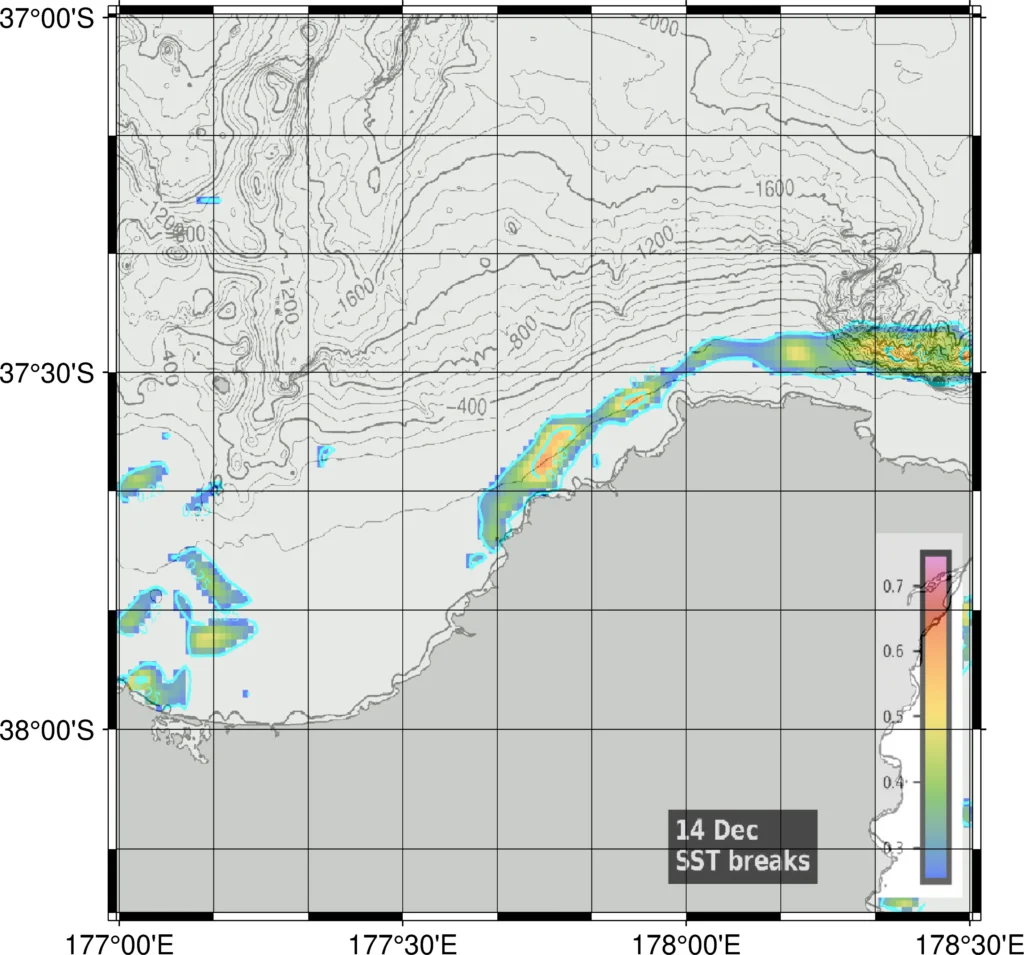
After the windy conditions of December 11, it took only two days (December 12 & 13) to re-establish the complex temperature structure by December 14 (Figure 5). There is a sharp 2 degree C contrast in alongshore temperatures between a warm pool of 20 C water off Whanarua Bay, and cooler 18C water off Hicks Bay. Even more notable is the strong front lying over the 100 metre depth contour, separating cooler inshore water from 1 degree C warmer water further offshore. This front is dramatically evident in the temperature breaks map, shown in Figure 6. A strong temperature gradient has produced a temperature break close to shore. The break is strongest off Whanarua Bay where the cool nearshore water meets the warm pool of water to the west. You can see the difference in the strength of the break by looking at the colour variation along the front, where red indicates a stronger temperate gradient.
Bottom line
It’s not that the maps that are different. The difference in the pattern of the SST and the temperature breaks is due to the effect of wind mixing out the temperature gradients and smoothing the temperature structure of the surface waters. When the wind calms and the sun shines, the heating of the surface water allows a complex temperature structure to redevelop, forming strong temperature breaks where the SST gradients are most intense. It won’t matter which map provider you use for your satellite maps. You will still see the same effect of the wind on the surface temperature of the ocean.
