Applying Big Data from Satellites to Solve the Fishers Dilemma
The fisher’s dilemma has always been where and when to find fish. There are many cues on and over the ocean that help fishers locate big game fish like tunas and marlin. These include the season and region, the water temperature, the colour of the water, the presence of slicks indicating converging flows, and flocks of birds or pods of dolphins feeding on bait fish. The success of other fishers in the area, activity of commercial long lining or purse seining vessels, and the bathymetry of canyon heads, seamounts and ridges are also important. Commercial purse seiners targeting tuna use helicopters or fixed-wing aircraft to help spot schools of tuna over wider areas than are visible from the ship. Echosounders are critical to image backscatter from baitfish and determine the depth and distribution of feed in the water below the boats.
Availability of satellite remote sensing imagery has added a new suite of tools for finding game fish, and a range of small companies now provide these data products to both recreational game fishers and commercial fleets. Dealing with the complex and voluminous remote sensing data, and interpreting the patterns in the imagery, requires expertise that leads these companies to advertise that they hire IT professionals, or oceanographers, or that they process their own data to achieve the best result for fishers. The data science and geospatial tools required include Python or R for analysis and mapping, GDAL for georeferencing imagery, and shell scripting for automation of workflows.
I produce fishing maps for game fishing (see this web site), and in this article I delve into the issue of variability. One of the concerns raised by fishers is about how recent the SST maps are. This is because they know that SST can change quickly, and they want the information to be relevant when they are out on the ocean looking for gamefish like marlin or tunas. In this article, I compare four days of SST imagery from New Zealand that were obtained during a period of exceptional wet weather that caused significant flooding in Auckland, New Zealand’s largest city.
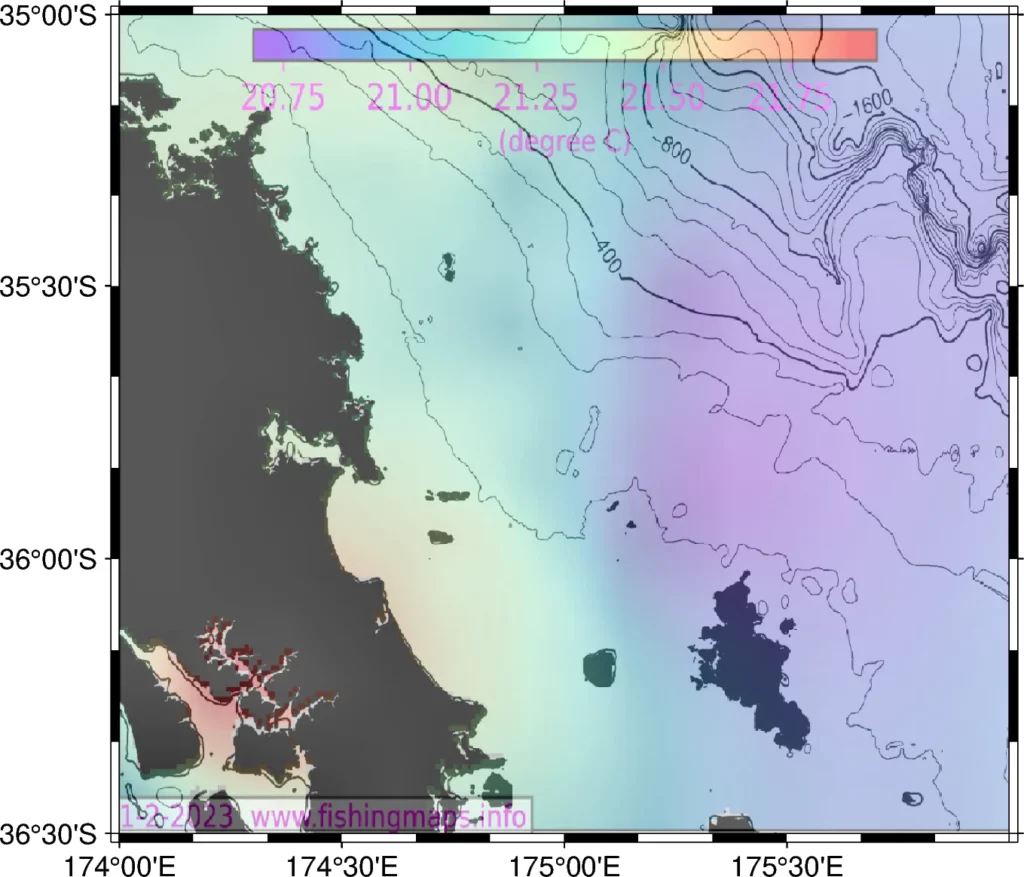
SST measured by satellites is the temperature in the upper few millimeters of the ocean surface, and this is affected by solar heating during the day, as well as by wind, which causes mixing with cooler water from below the surface. Cloud-free imagery processed at the Jet Propulsion Laboratory in California by the Group for High Resolution Sea Surface Temperature (GHRSST) is a blend of nighttime data from several satellite instruments and from temperature measurements in the ocean. This surface measurement can differ a little from temperature even a metre below the surface, but the spatial patterns of SST still provide an essential guide to warmer water and areas with strong temperature gradients where game fish are often found. These maps show the SST patterns in four consecutive days around the Northland region of New Zealand, which is an important area for marlin big game fishing.
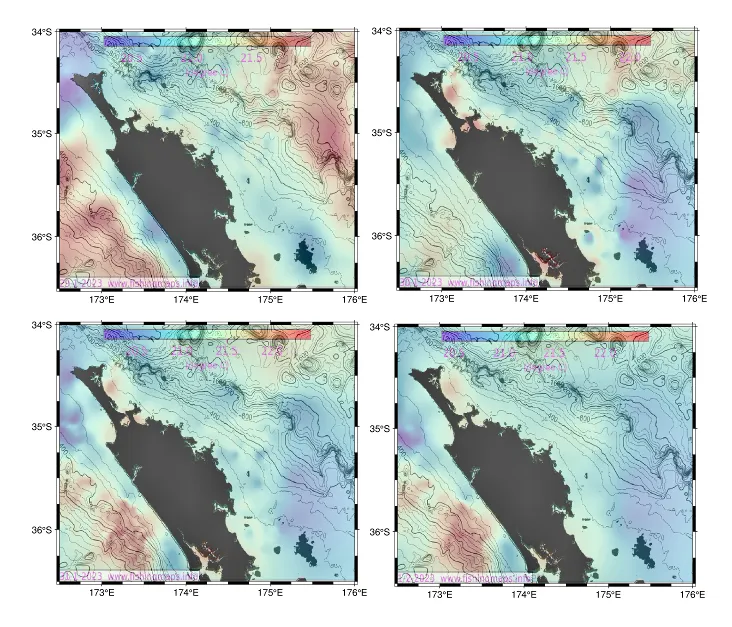
These SST — bathymetry maps are produced daily and the temperature colorbar is scaled to the range of the temperatures, so they differ slightly. What is notable when the top two maps are compared, is that the warmer temperatures off both the east and west coasts cooled by about 1 degree C in a day. After another day the water on the west coast warmed up by about half a degree, but the east coast water stayed cooler.
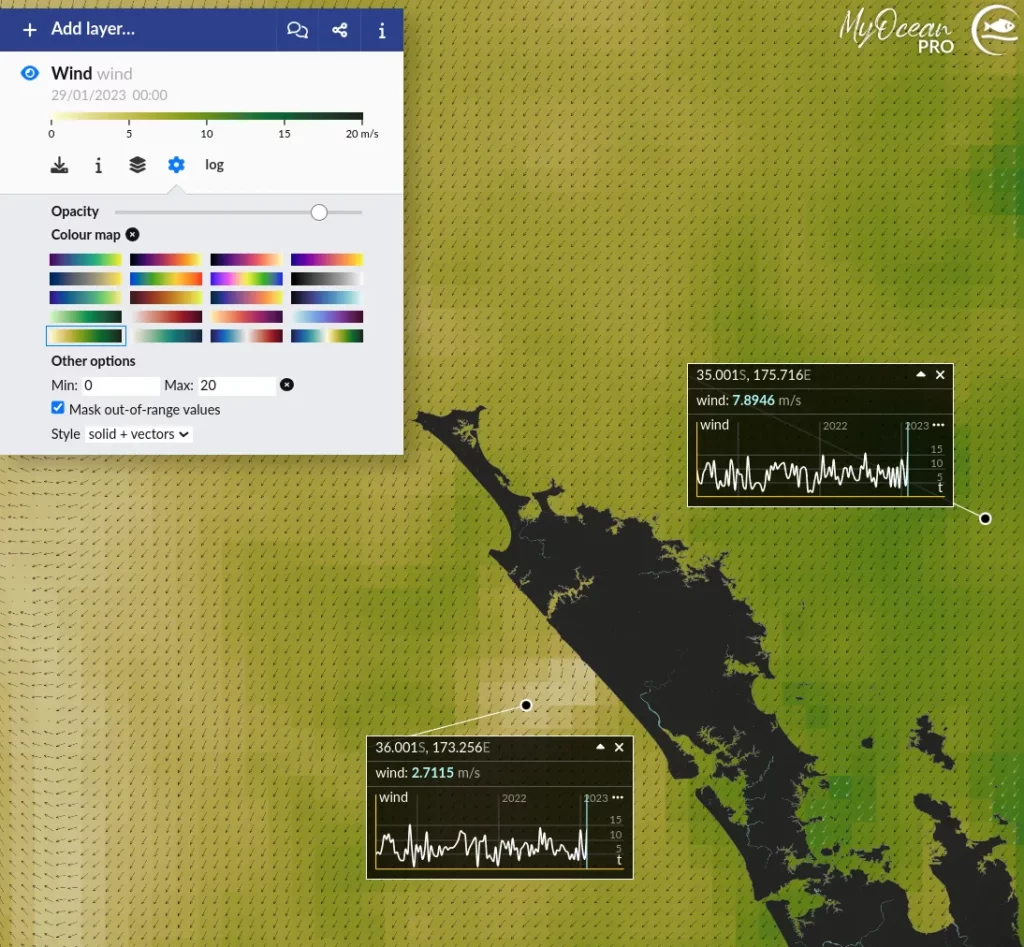
What caused these changes? It was likely due to increased wind over the ocean causing mixing of the surface water with cooler waters beneath, which would lower the SST. There may have been a difference in the winds between the east and western sides of Northland. Inspection of the wind data in two areas where the water was warmest supports these ideas.
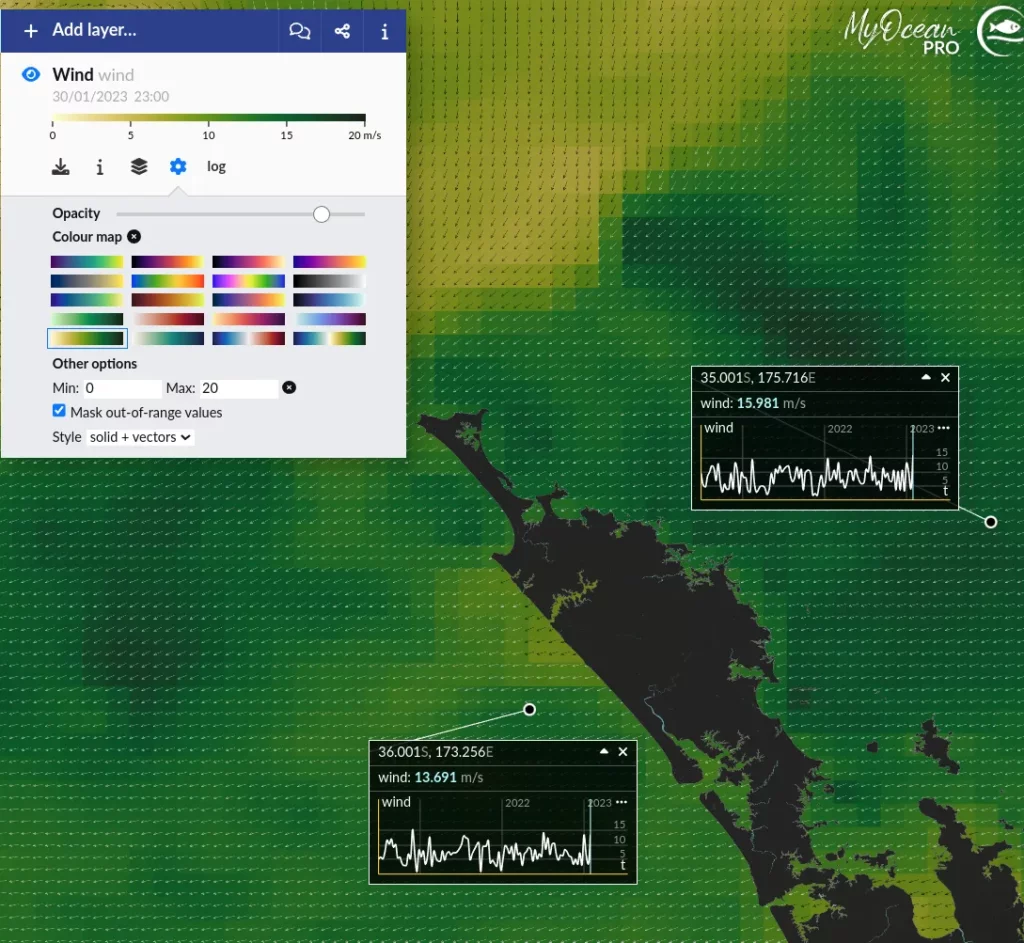
On the 29th January the wind speed in the warmest spots was about 16 knots off the east coast compared to 6 knots of the west coast (Figure 2) with predominant northeastward direction. The wind increased steadily over the next few days, so that by the 31 January and 1 February, the wind off the east coast was about 32 knots off the east coast and was about 28 knots off the west coast (Figure 3). The increase in the wind speed would have caused the ocean surface to mix and cool. There is also some indication that the wind speed was lower near the warmest SST on the west coast. You can see this as a lighter colour patch between the Kaipara and Hokianga estuaries in the maps below.
This is not a scientific analysis, but it illustrates a point that is relevant to fishers. The temperature gradients can be disrupted in a day by a change to windy weather, as seen here off the east coast of Northland. On the other hand, large patches of warmer water can also persist over several days in different parts of the region where the winds are a bit lighter, as seen here on the off west coast of Northland.
As usual, nothing is simple in the ocean, and daily satellite-derived fishing maps allow us to examine the data as a guide for where the best game fishing is likely to be. SST is only one of the tools available, and future articles will examine other complimentary data, like sea surface height and ocean colour, that can provide additional information for fishing. I will be posting a new product providing the latest 4 days of SST data for different regions on my website soon.